
Reporting in Light
This guide covers the reporting functionality in Light and explains how to use the different report types to analyze your financial data.
Light currently supports four types of reports:
-
Table Reports
-
Pivot Tables
-
Text to Chart
-
Custom Reports
Table Reports
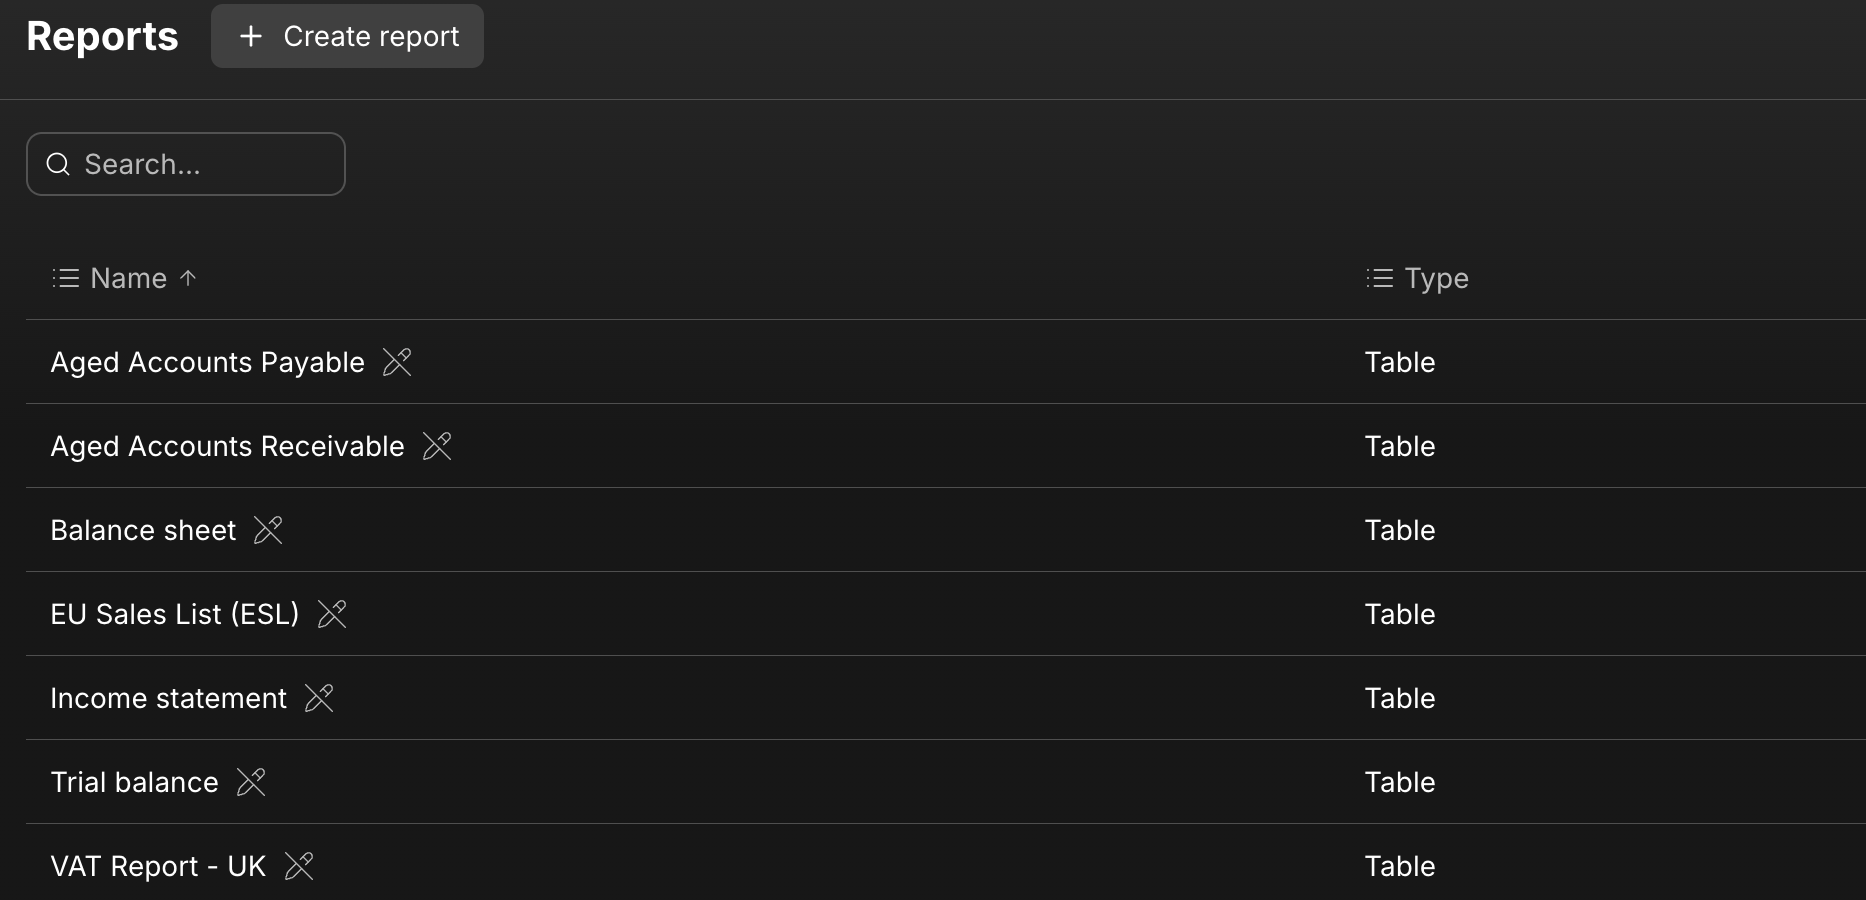
Home Screen --> Accounting --> Reports
The system provides you with some default reports, such as Income Statement, Balance Sheet, Trail Balance, Aged AR, Aged AP & VAT.
When you click in the report there will be some options for filters as follows:
-
Entities - You can select a single entity at a time or multiple companies or a full group consolidation)
-
Dates - This can be the desired time frame the user needs. example 1 month or quarter or annual etc.
-
Currency - The currency they want show the report in.
-
Custom Properties (these would be defined at the stage of CoA setup, examples include Department, Location, Projects etc)
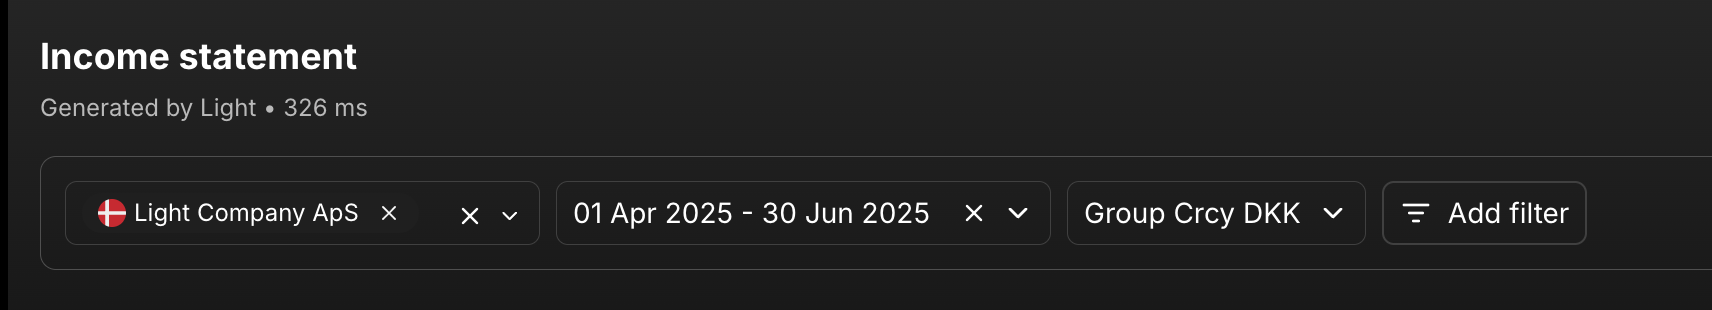
Once you have set the criteria the report will update automatically.
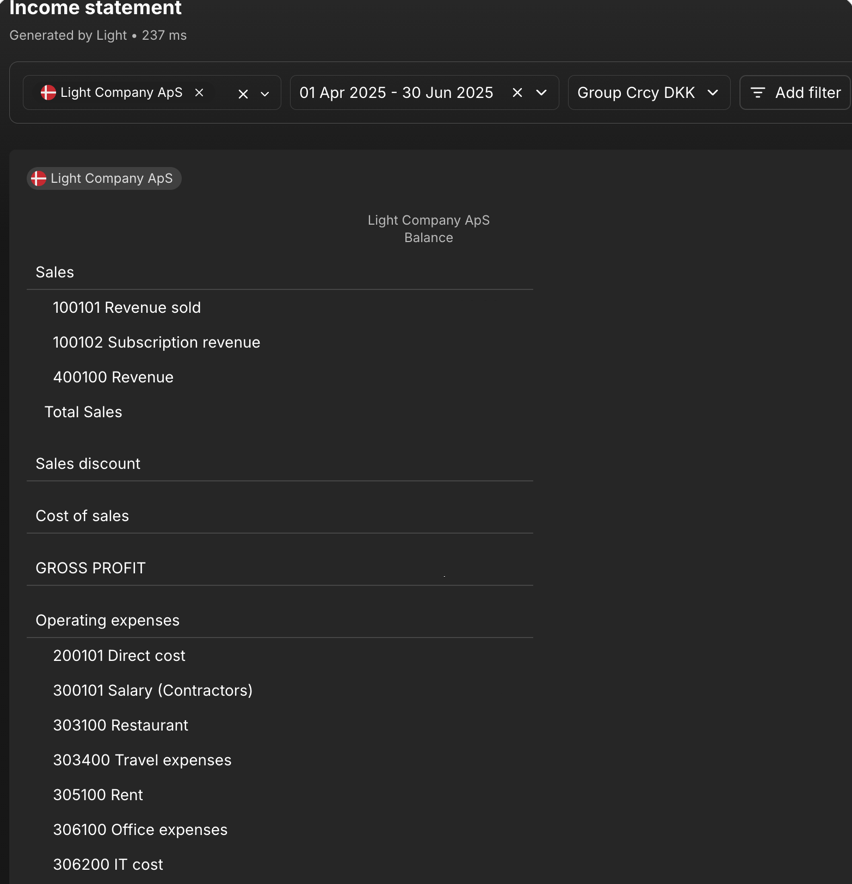
For a single entity the report will look something like this:
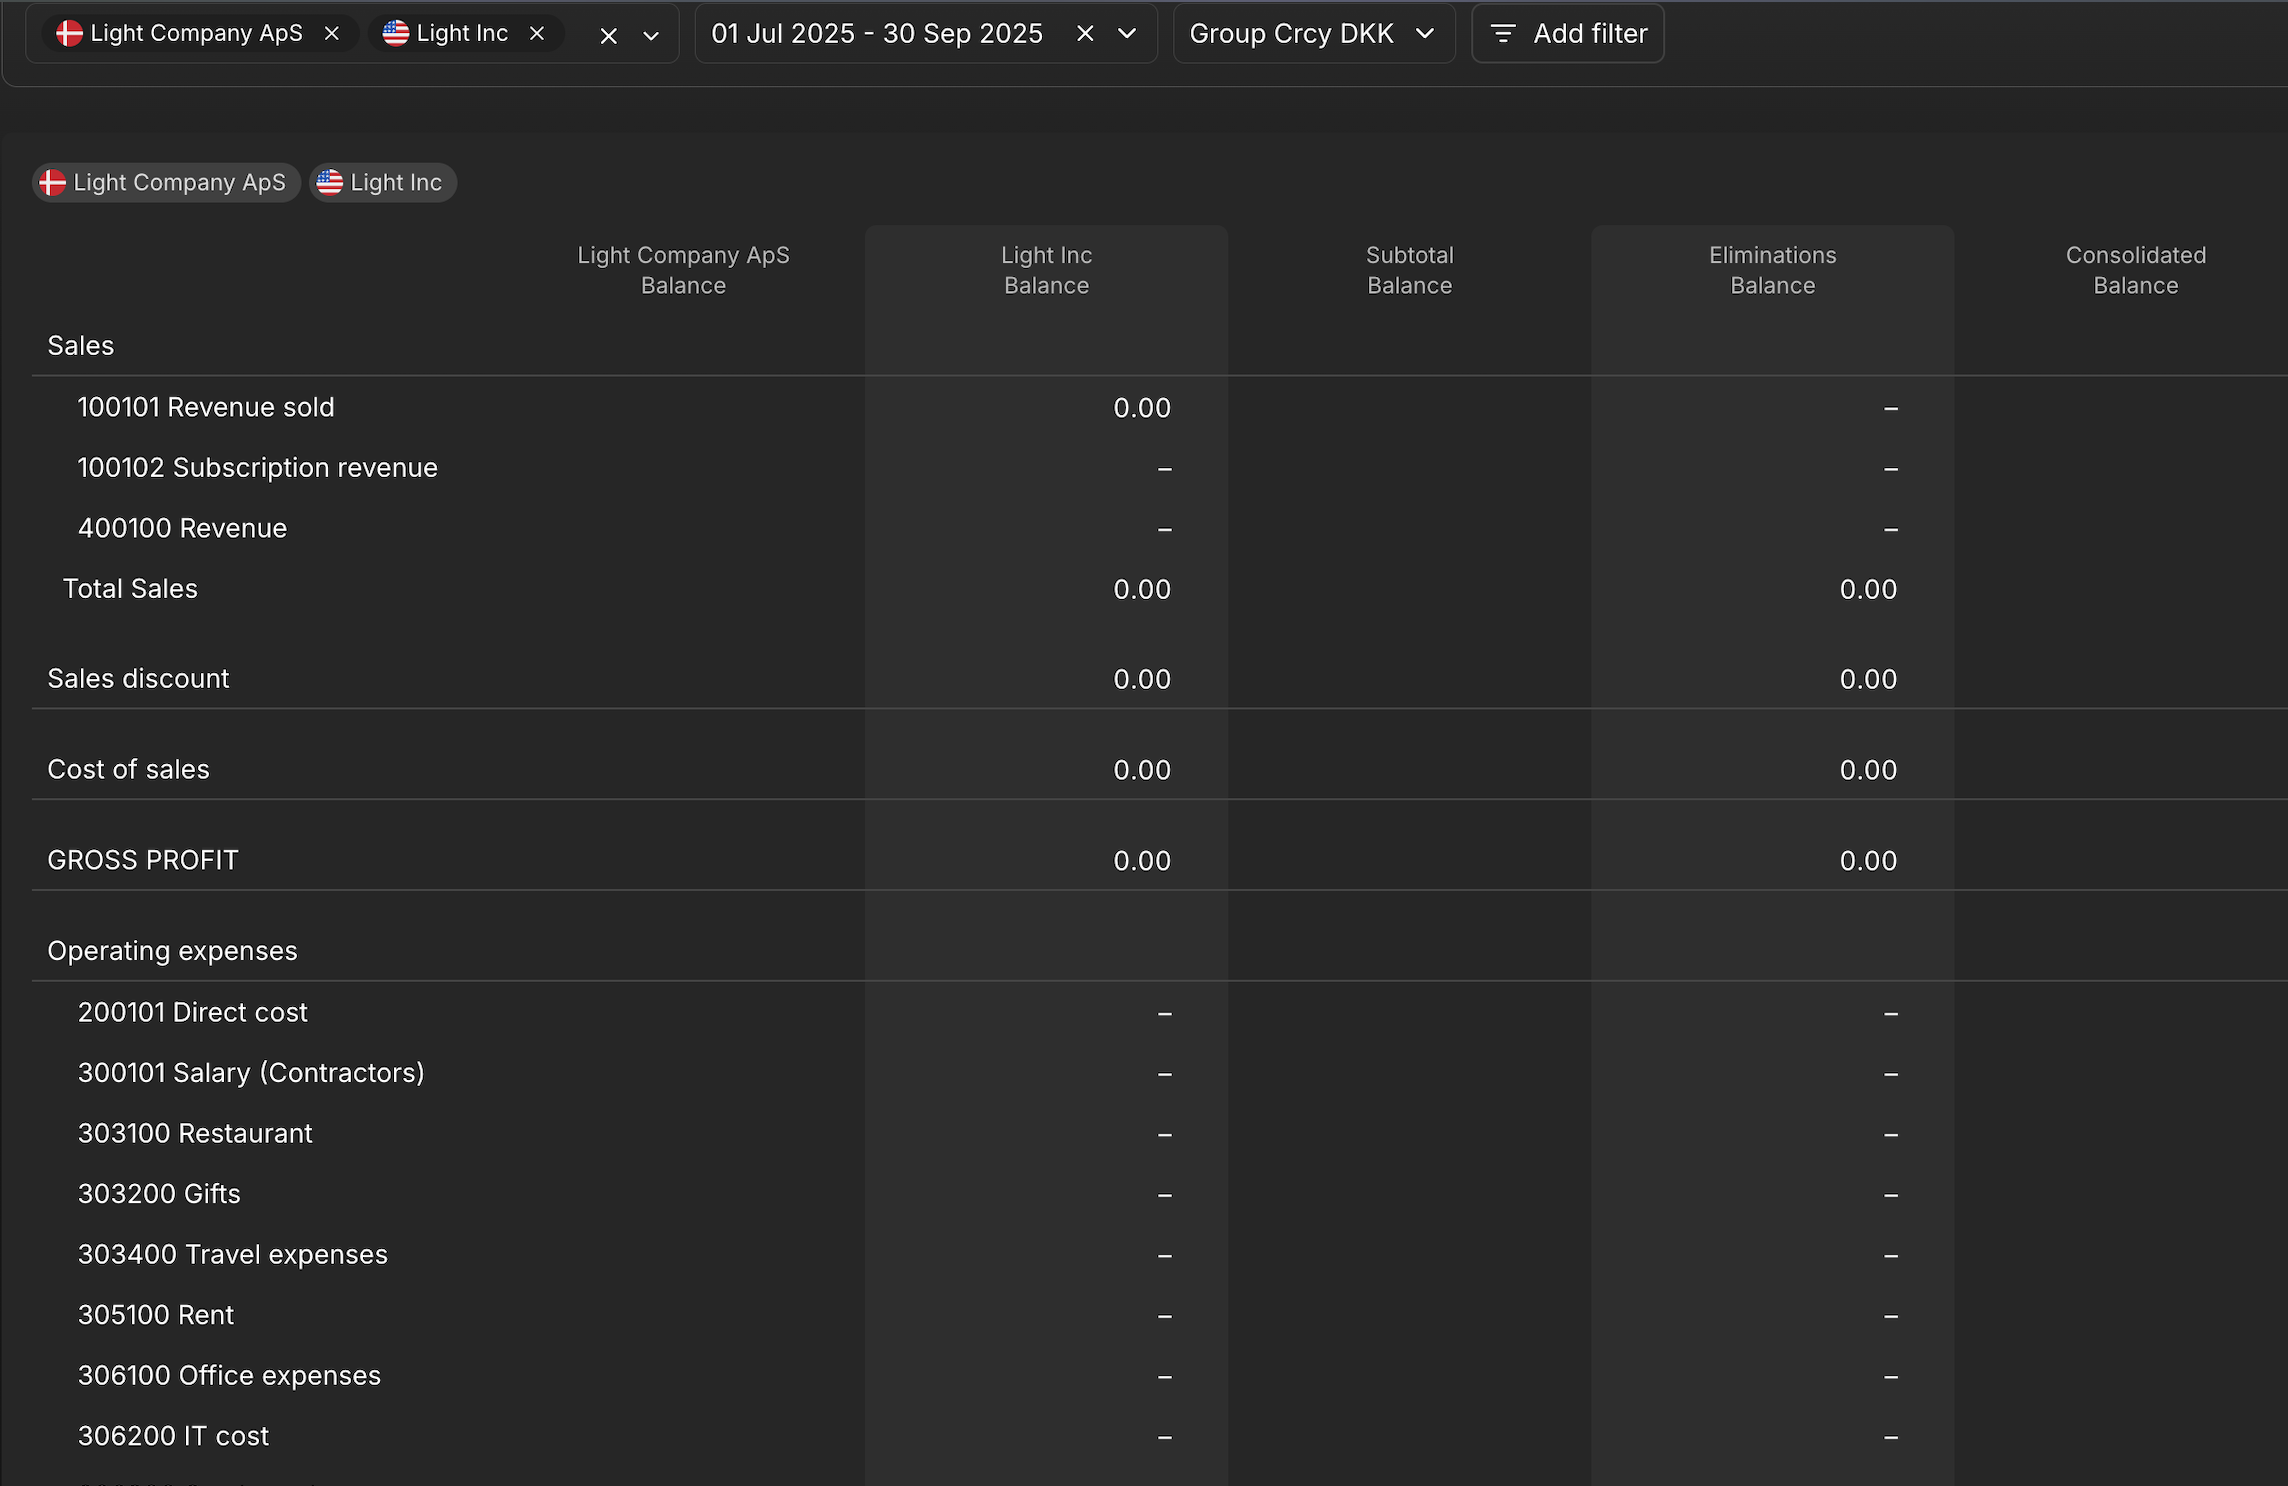
If you have chosen more than one entity, for example a consolidated group report it will populate a consolidated balance figure for you as well. This will also contra of the elimination accounts.
Pivot Tables
Home Screen --> Accounting --> Reports --> Create Report --> Pivot Table
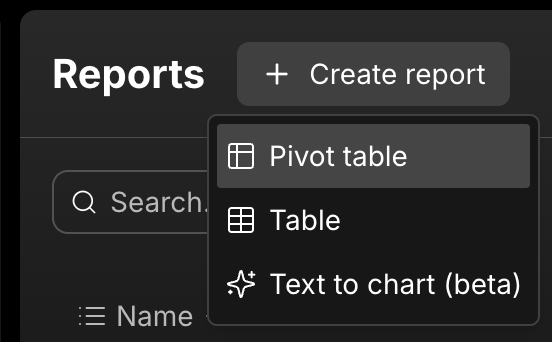
Once you Click through it will resemble something like the pivot table you find in excel/googlesheets and simple to setup.
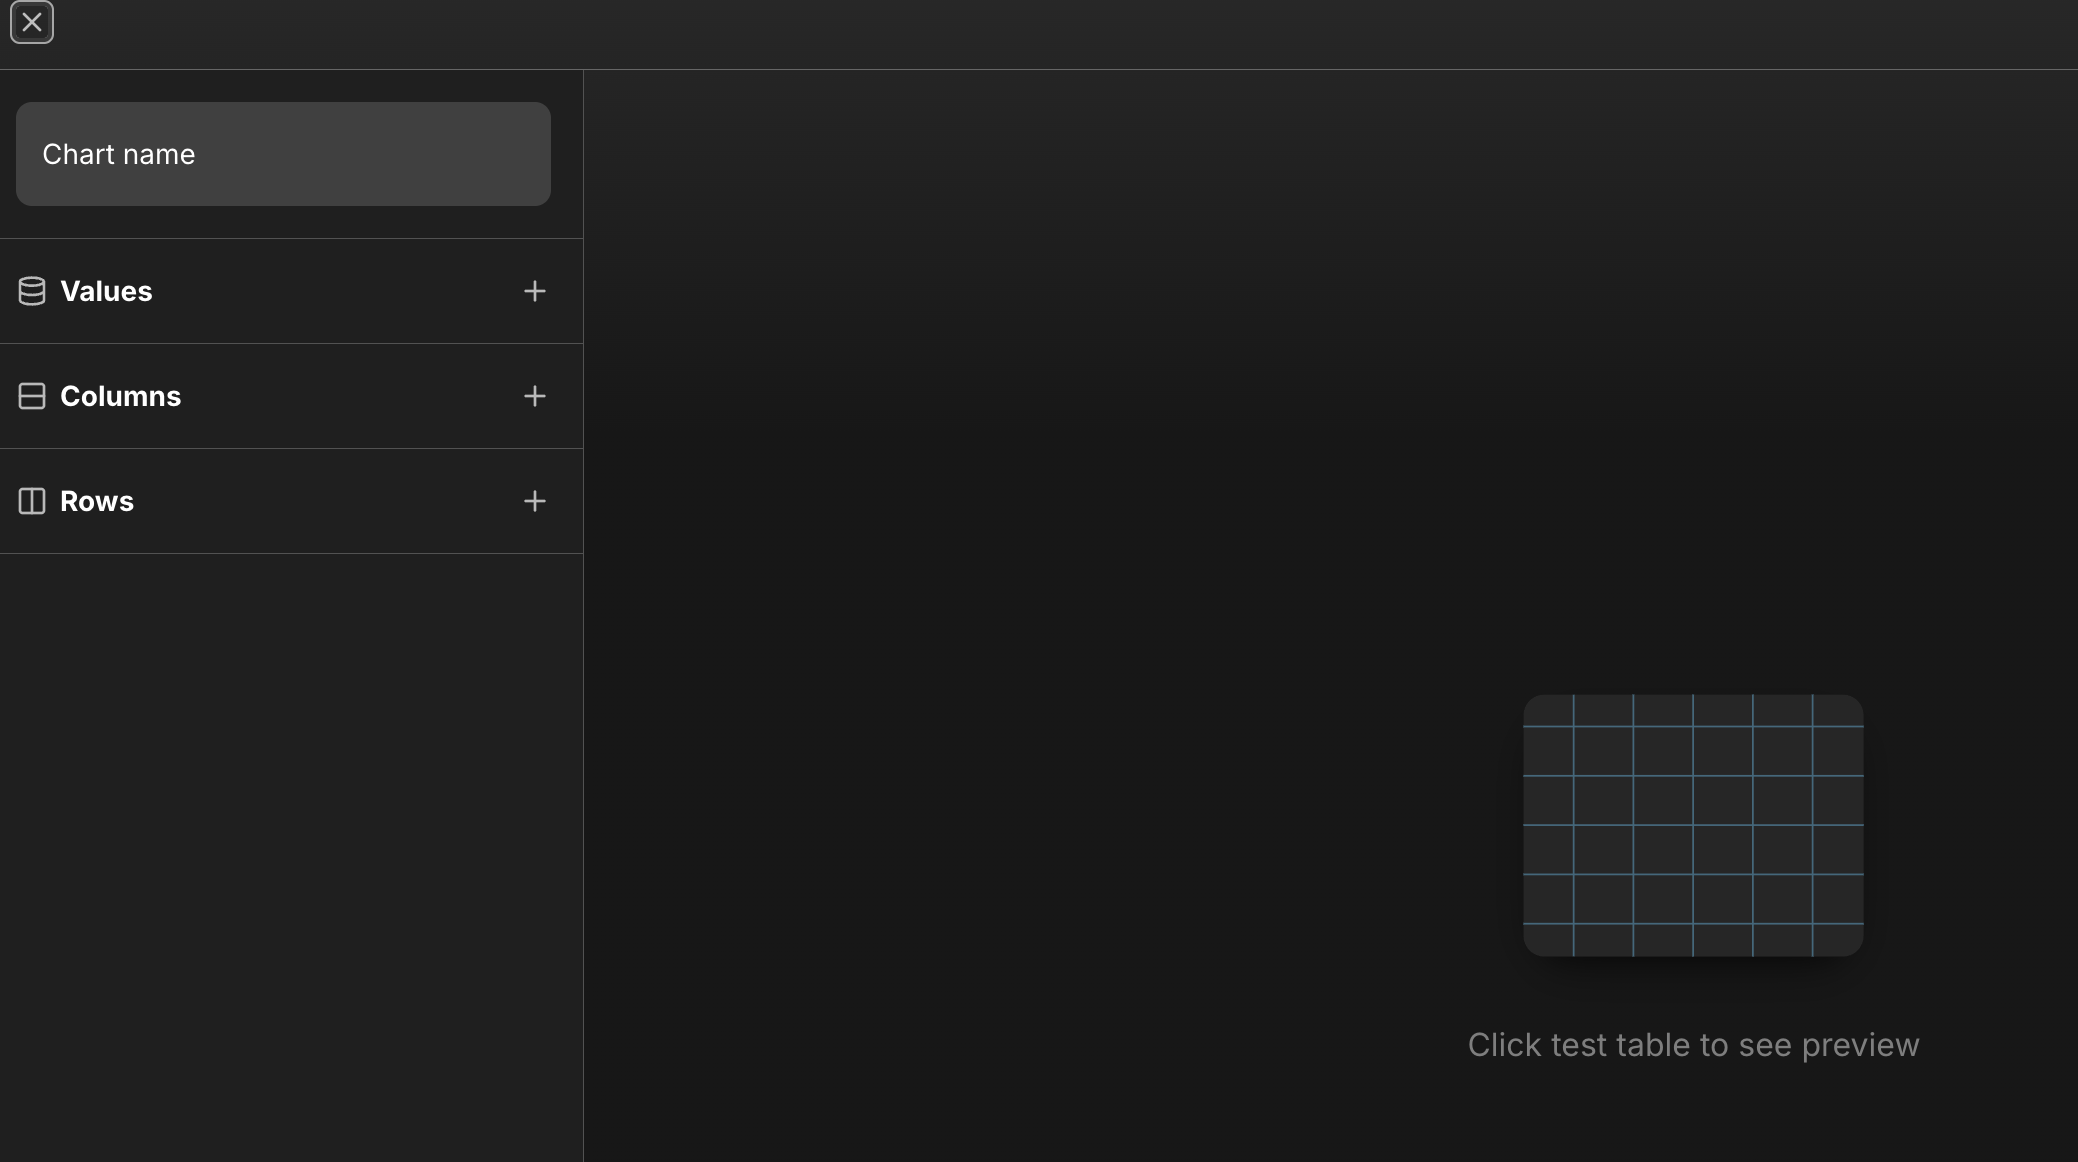
You can give chart a name and start pulling through the fields you require.
Once you are happy, click "Test Table".
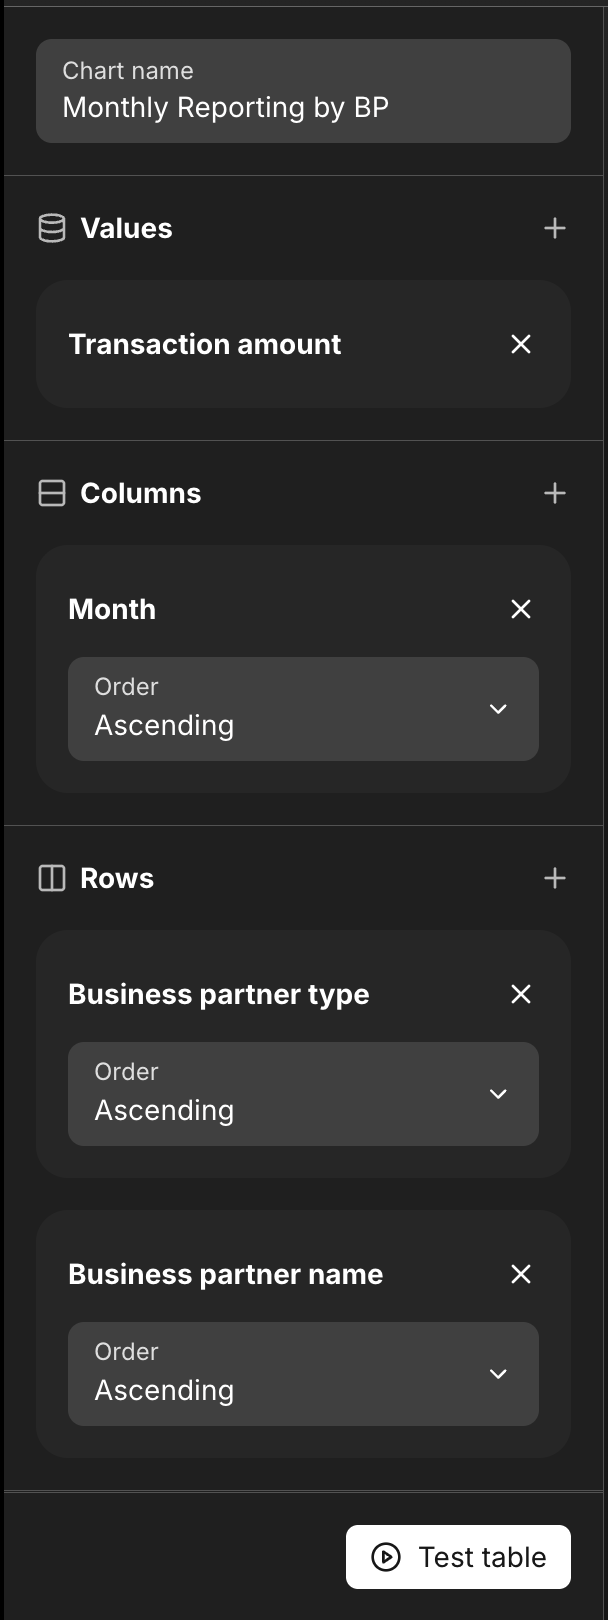
In the above example I am creating a report based on BP type then BP Name and I want to be able to see the trend month on month.
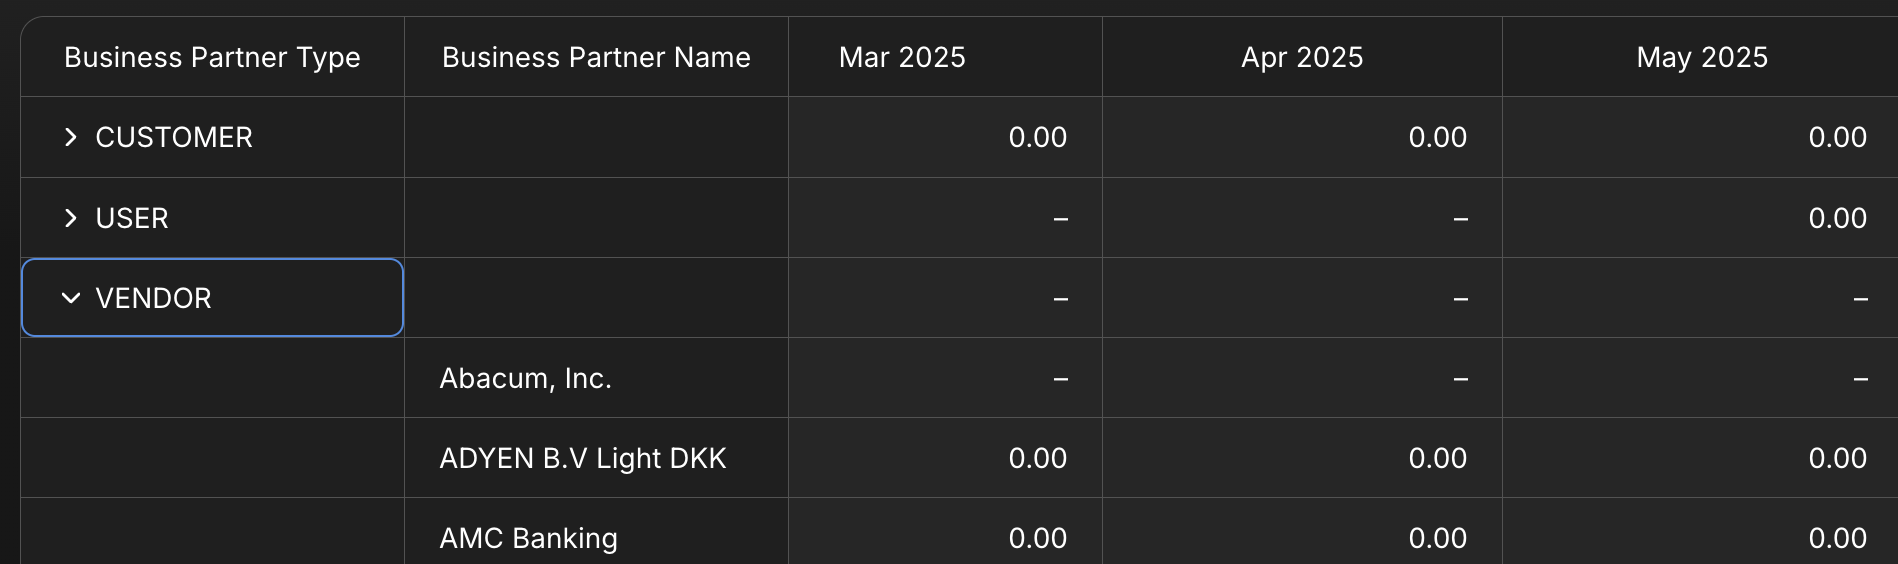
You can see from the report above, that I can role this up to see by BP Type, or if need to see the detail, I can expend BP Type and this will give me a more detailed view of all BP Names. This has extrapolated out, month by month.
Once you are happy with your report you can save down by clicking in the top right.
Custom Report Creation
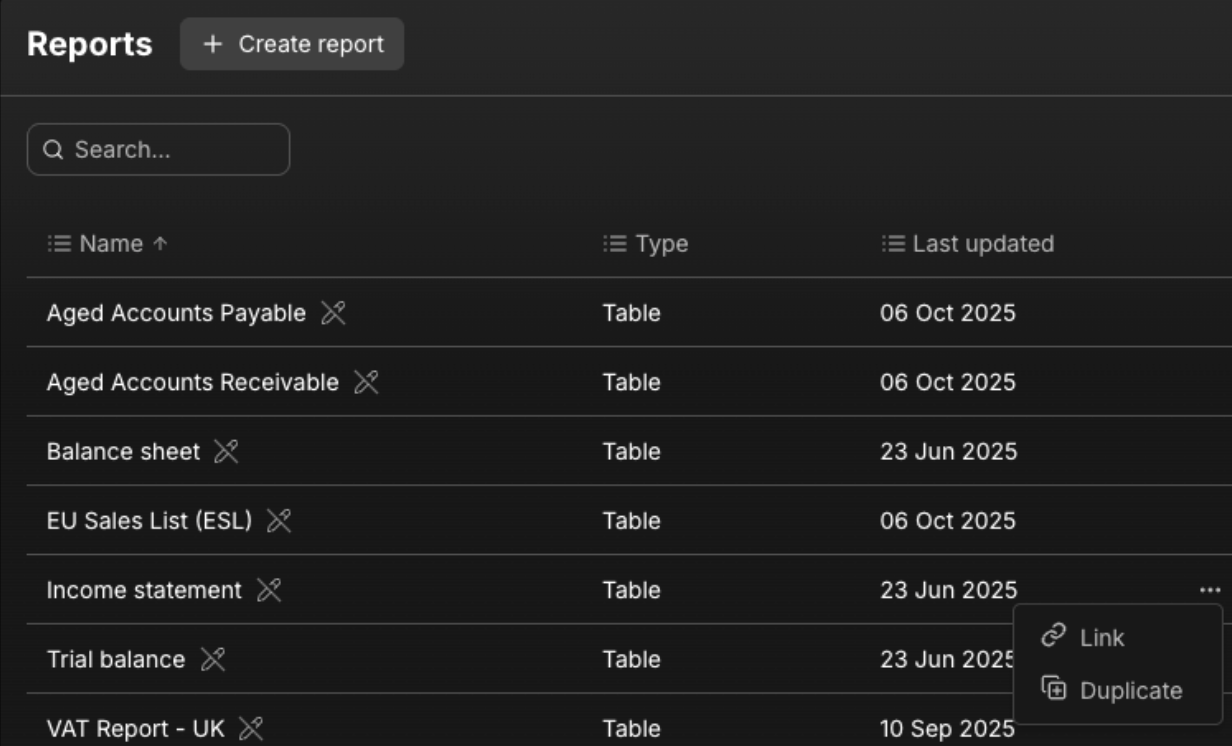
Reports → Income Statement (Duplicate)
Press the 3 dots on the right hand side of the line and click duplicate.
Once this has been duplicated, rename and open the file.
Based on the reporting requirements you can set this up so Revenue and Cost codes can be expanded or summarised.
Example:
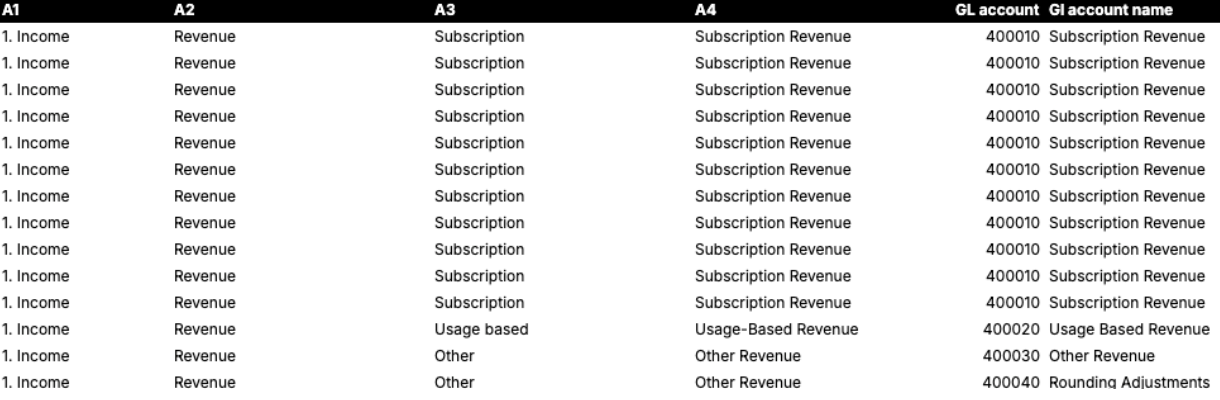
Based on the above example, you will want to build the report based on the granular level first, then each level it groups up into.
Open the report then press edit on the right hand side.
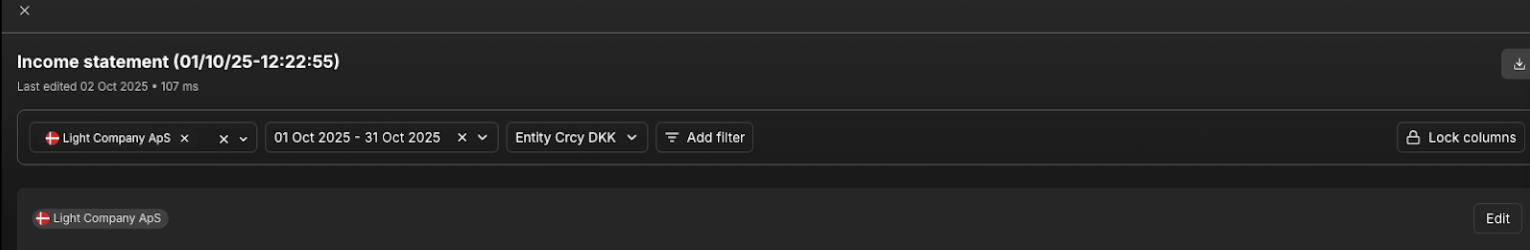
You now come to a screen where it allows you to add and remove rows and create the report layout you want.
When you add a new row you can then type a formula based on your criteria. See example below:
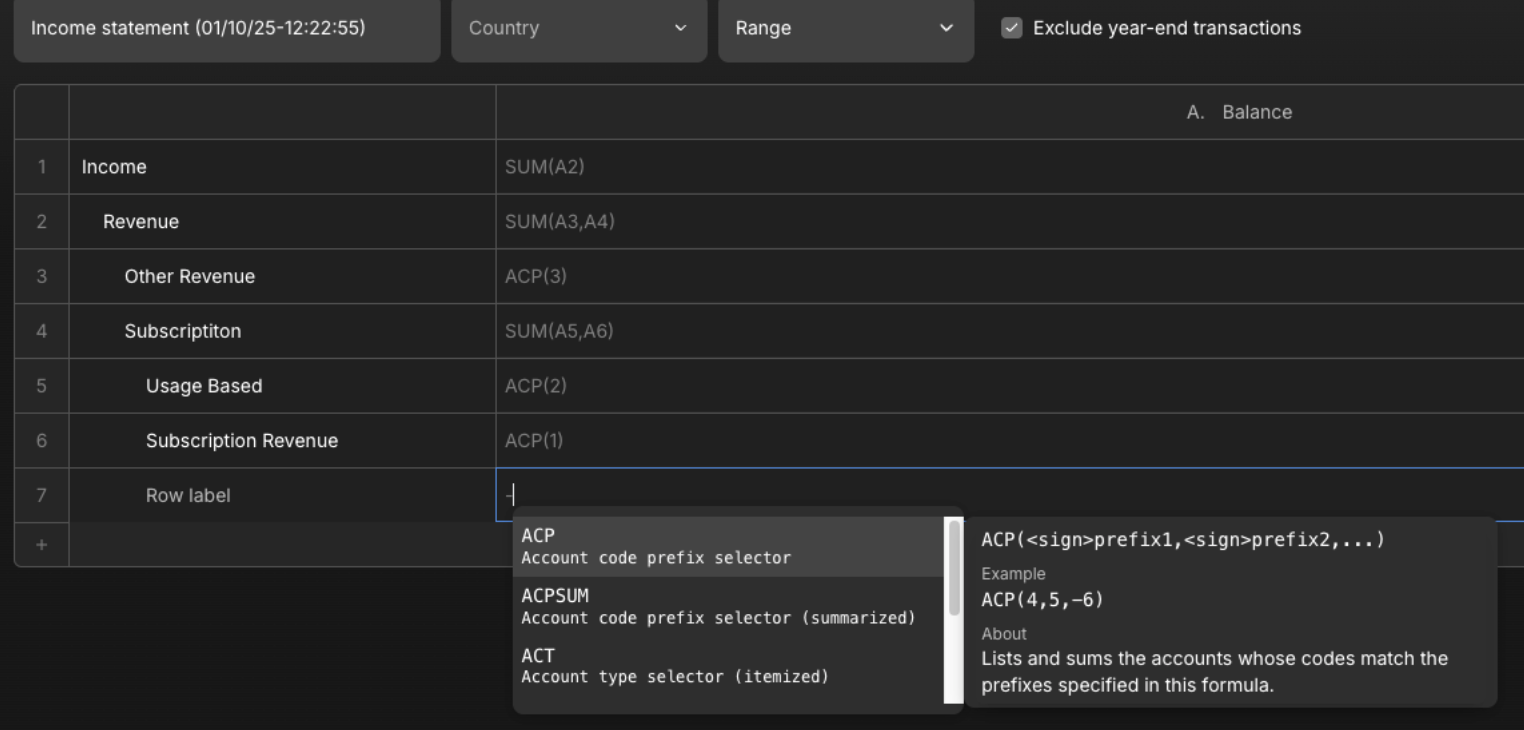
There are a number of ways to report. You can base this on Account code or type and sum them, see below the list of different ways to do this and examples.
ACP = Account Code Prefix Selector
Lists and sums the accounts whose codes match the prefixes specified.
Example: ACP (4,5,-6)
ACPSUM = Account Code Prefix Selector (summarised)
Sums accounts whose codes match the prefixes specified.
Example: ACPSUM (2,-3,4)
ACT = Account Type Selector (itemised)
Lists and sums accounts whose types are specified in this formula
Example: ACT(REVENUE,-COST_OF_SALES)
ACTCUR = Account Type Selector Currency
Lists and sums accounts whose types are specified in this formula. Only for accounts in currency such as BANK, CARD, CASH_AND_EQUIVALENTS
Example: ACTCUR(BANK, CARD, CASH_AND_EQUIVALENTS)
ACTSUM = Account Type Selector (summarised)
Sums accounts whose types are specified in this formula
Example: ACTSUM(REVENUE,-COST_OF_SALES)
SUM = Summarised
Sums the values of the cells referenced in this formula.
Example: SUM(A1,B3,-A4)
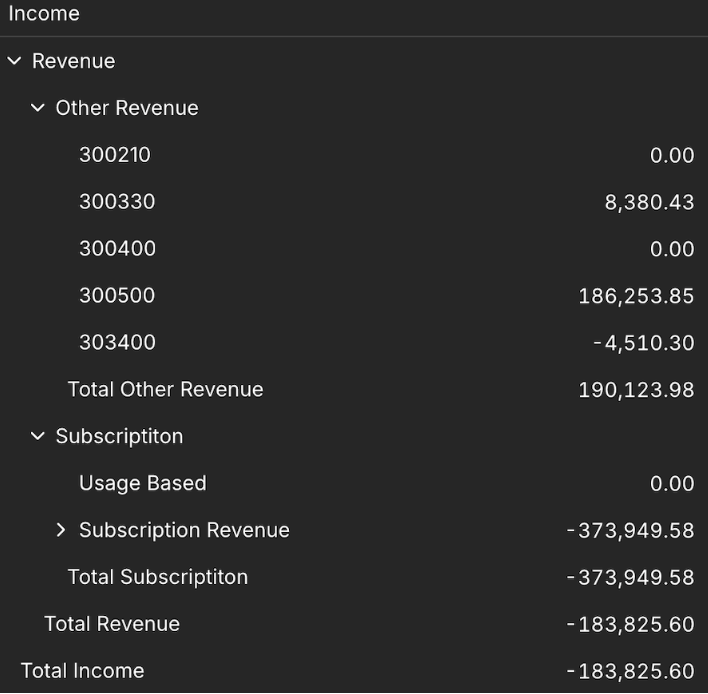
Based on the above criteria you Income statement will look like this.
You are able to get the granular level of detail required based on the reporting Cat A4 then roll this up to a Total Revenue Cat A1. The report can be expanded or collapsed depending on the view you require.
Please note that when you create the formulas you must remove the = sign otherwise the report will not run.
You can repeat this process for OPEX as well.
Once you are happy with your report you can save down by clicking in the top right. Save table.